


Thinking systematically about data collection within organisations in the development space is essential, however it often doesn't get the required attention. Data collection may be required to
- assess longer term progress towards organisational goals or
- simply to record day-to-day activities/operations an organisation carries out. The degree of planning & statistical rigour needed for each is very different. This article outlines what one must think about when collecting data to assess long term progress, which is the more intensive of the two data collection efforts.
Table of Contents
- The bigger picture: Goals
- Outcomes and Indicators
- Surveys
- Technical Considerations
- Training of Surveyors
- Sampling
1. The bigger picture
Data collection to assess progress should be closely connected with the purpose of an organization and it's programmes and should evolve with it. Often in practice however these two get de-linked. Surveys are developed for data collection based on templates that are at hand. Finally when data analysis is undertaken to understand impact the mismatch is evident. Often data collected doesn't speak to the goals or is irrelevant/redundant or worst of all misleading. Hence, foremost, adequate thought should go into the articulation of purpose/goals. Staff within the organization, from head to field persons, must understand and agree on these.
 |
| 1. Link between data collection and goals |
2. Goals are not enough, we need outcomes and indicators
If my goal is to shorten my travel time, I must determine an outcome that will lead to the desired goal. An outcome is chosen,
wherein prior research indicates a causal link between outcome and goal. One outcome that could lead there is to build a faster car.
It's possible in this case to directly measure progress towards the goal (i.e. travel time in minutes/hours) or indirectly by
measuring progress on the outcome (i.e. speed of car in mph). There is little debate on what the indicators for progress could be.
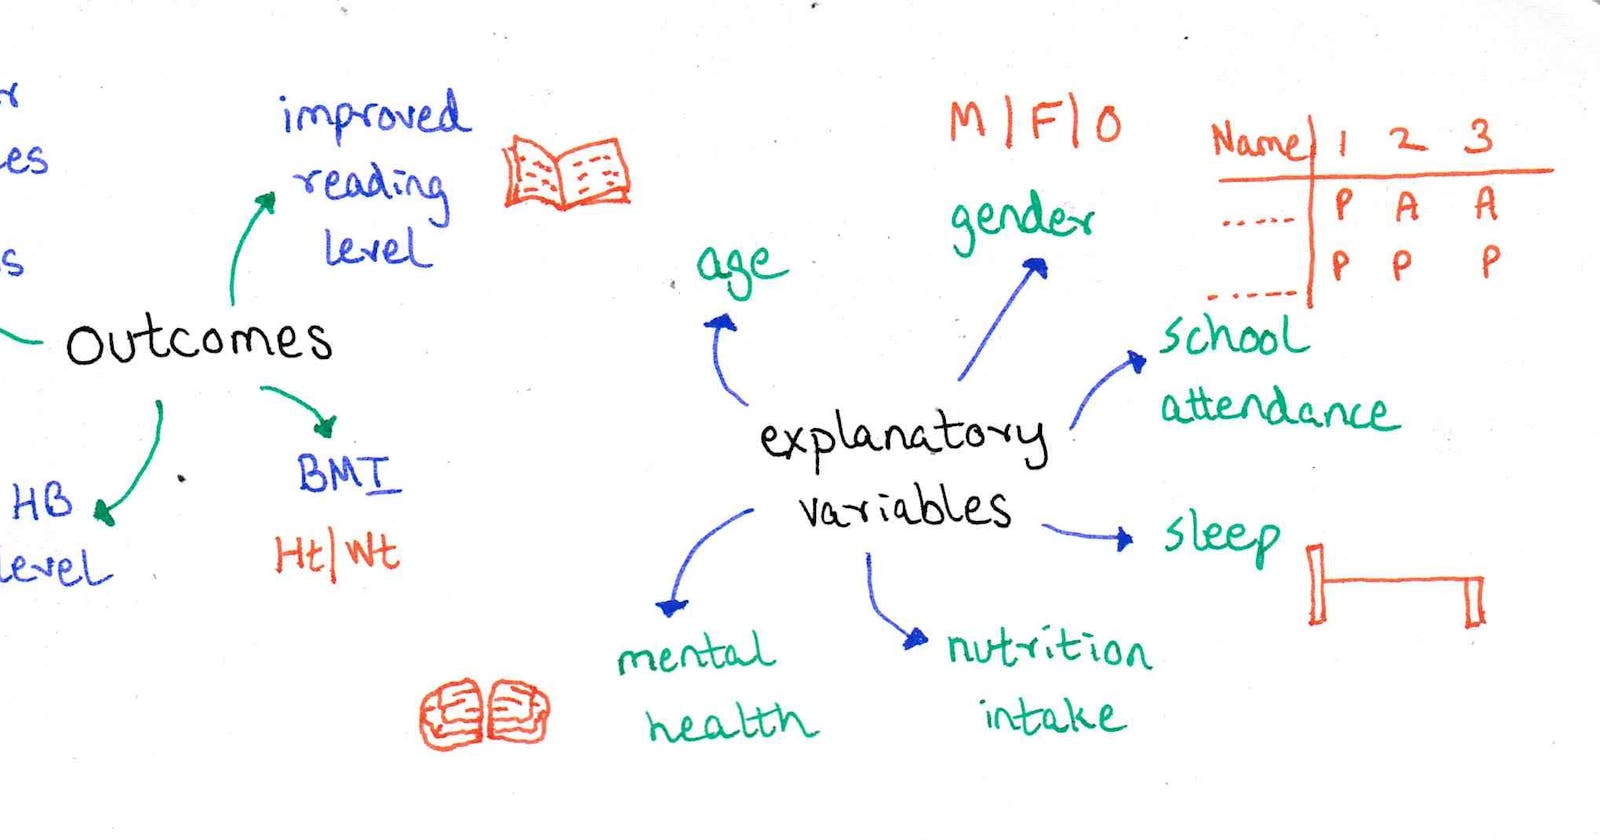
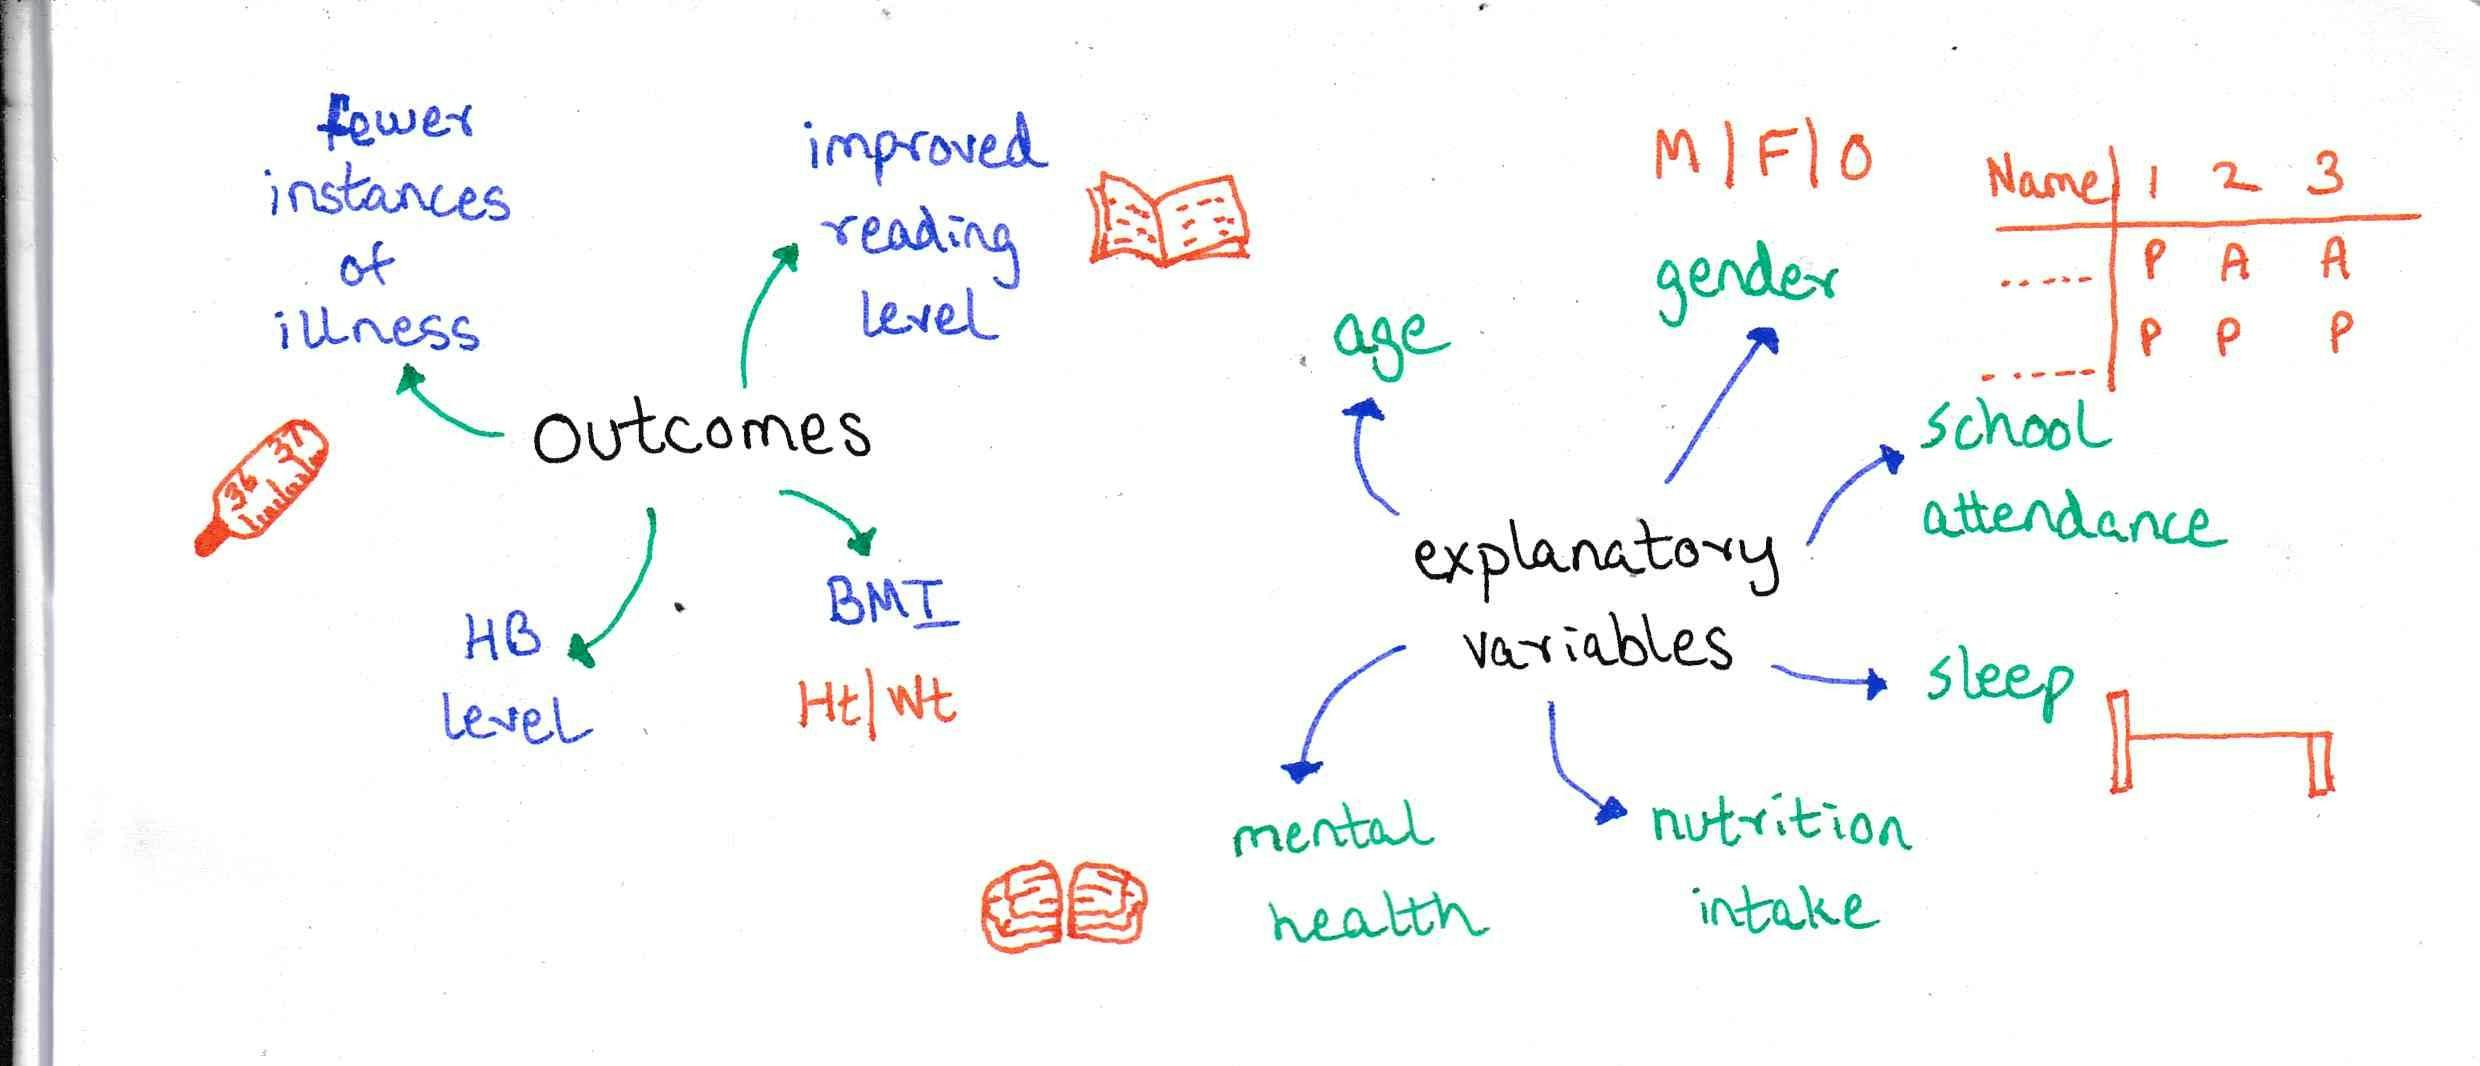
If my goal however is to improve a community's health, it's far from certain how to measure progress. Perhaps, prevalence of illness is one indicator.
Or number of sick days per month? However these indicators are comparatively difficult to measure compared to indicators of having achieved an outcome.
In this case for instance, an outcome could be better sleep, or better nutrition, both of which are strongly correlated with good health. Indicators for
having achieved these outcomes could be a score on a sleep survey, or medical tests to determine the effect of nutrition, e.g. Hb test to measure
progress towards lower iron deficiency. In some cases, direct measurement of the indicator is not possible, in which case a proxy is measured,
for instance, here the percentage of the recommended dietary allowance (RDA) for iron being met.
 |
| 2. Goals < Outcomes (Indicators) |
3. Surveys
Once indicators are established we think about systematic surveys to capture the effect of outcomes. Surveys can be developed from scratch , but in many cases, especially for themes that are well studied, pre-developed and validated surveys are readily available.
If such surveys don't readily exist, one has to carefully consider the data points to be collected. Besides capturing just the outcome indicators, surveys should also collect explanatory variables for variations in the population. These could vary depending on the goal, however some common data points are age, gender or any data that captures variation in the application of the intervention. For instance this could be whether school attendance is poor, which could explain low Haemoglobin levels, since the child in question would miss their mid-day meal and RDA for iron.
Special attention should be paid to which questions could lead to erroneous answers, either because a respondent doesn't wish to answer truthfully or because memory errors could lead to erroneous results. Questions such as these should have a "Don't know" response option.
 |
| 3. Surveys - What to include |
4. Technical considerations
A brief note on technical considerations is given here. However these will be elaborated on in a separate article.
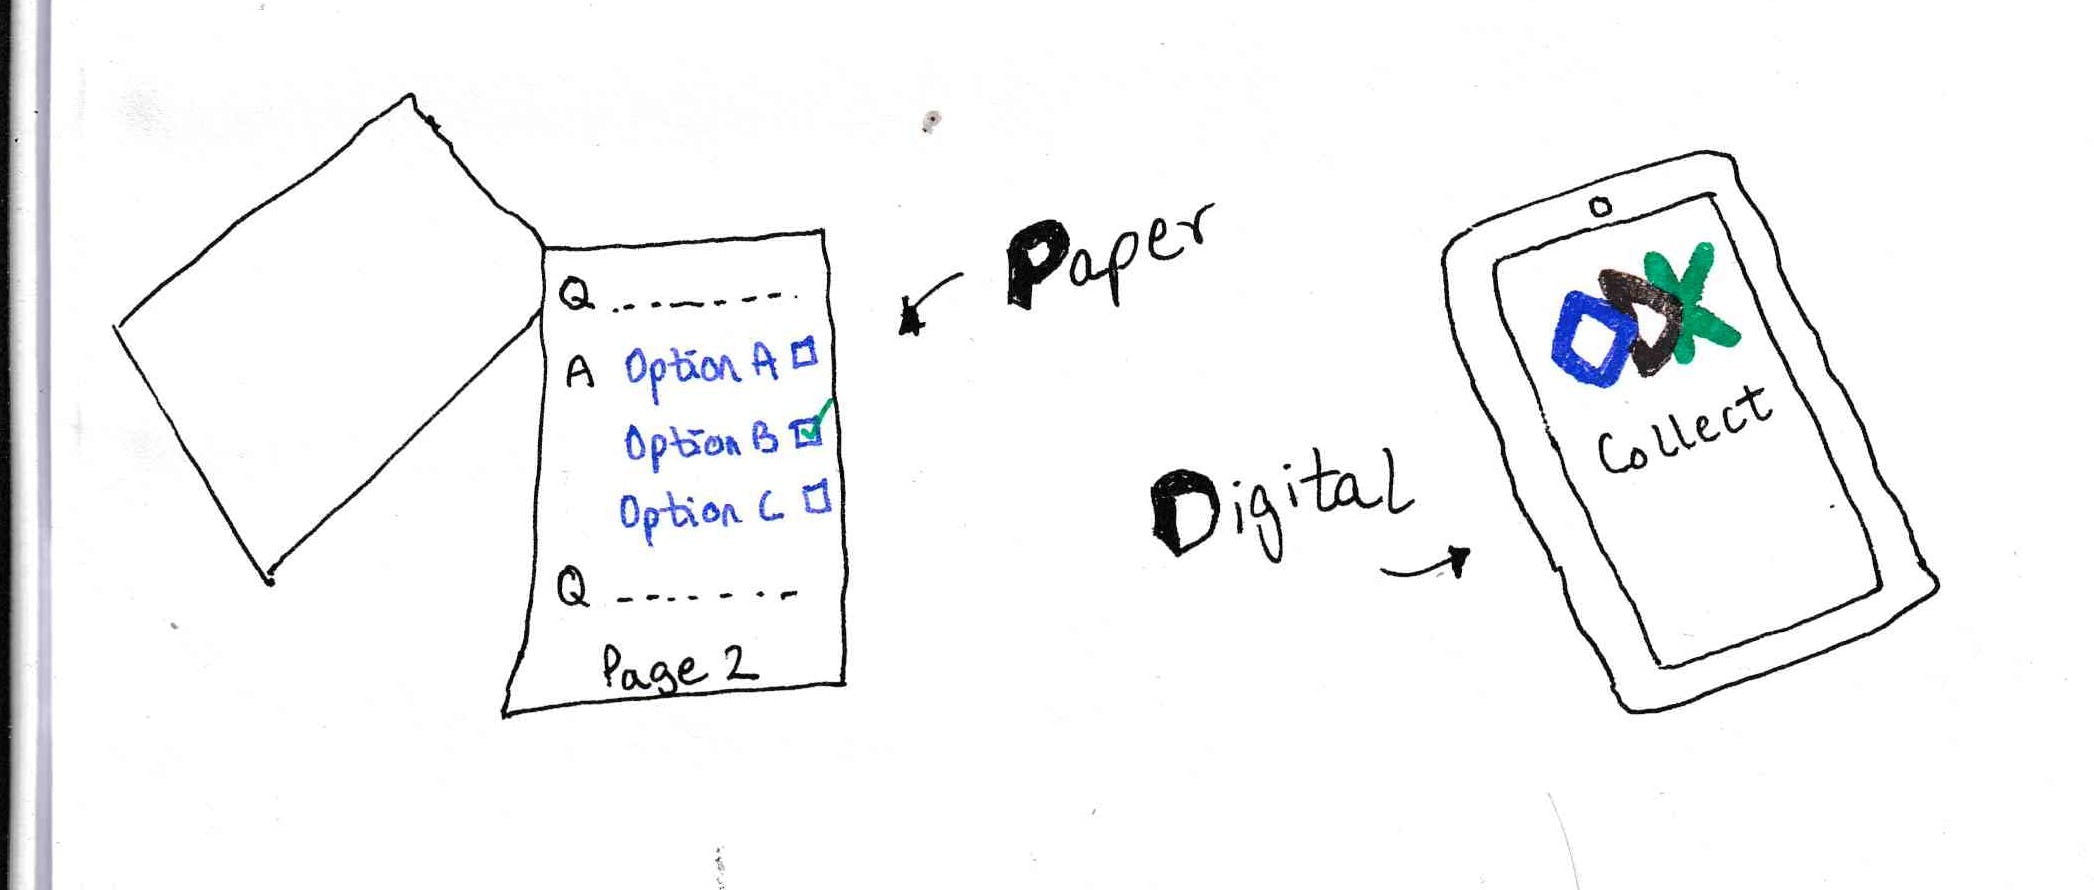
Surveyors may still choose to use paper surveys. Even if this is the case, it is beneficial to use tabular formats to capture responses and consistent notations to indicate choice of an answer. These responses can then more easily be recorded in digital formats using OCR technologies than if the paper format was ad hoc and inconsistent.
If the choice is to go for digital data entry, a few main points should be taken into consideration. Ensure that enumerators are well trained on the tools (apps) they will use for data collection. Choosing apps that work offline should be a priority. It should be possible to save submissions that are incomplete. The data collection app should allow for creating surveys questions and applying form logic as desired. Check out this post on survey form creation for more details.
 |
| 4. Technical considerations |
5. Training of Surveyors
The first step in training surveyors is ensuring that the objective of the survey is well understood. Beyond this it is important to ensure appropriate training in how to approach survey respondents and ask survey questions. A few simple pointers to keep in mind would be
- sampling criteria should be well understood, see next section
- approach respondents with courtesy
- introduce oneself/organization and purpose of visit
- check if potential respondent meets eligibility criteria for survey
- check individual's time availability and obtain consent for survey
- stick as close to the given wording as possible, avoid leading questions
- ensure each question is well understood, translating to another language or elaborating on it's meaning as necessary
- ensure enough time for respondent to reply, avoid prompting a response
- remind them that "no response" or "don't know" is always an option.
- if survey is long in nature take a break as necessary
- if survey requires medical measurements, ensure satisfying eligibility criteria are met
- ensure individual's contact details are obtained if the survey is longitudinal in nature
6. Sampling
This post does not go very deep into sampling strategies, but it is a subject I'm keenly interested in and I hope to write more on this soon.
Sampling starts with determination of the unit for making an assessment. For example, the unit of the respondent may be a household or individual. However the unit of assessment/ study may be district level/block level/ neighbourhood level and so on. The total population would hence be determined at the level of unit of assessment.
6.1 Sampling strategies
sampling strategies broadly fall into either probability sampling or non probability sampling, each of which is further subdivided into sub-categories. Depending on constraints you would choose one of the two. Non probability sampling may be chosen in early stages of exploratory research, in qualitative research or in studies where the target is a specific sub-population; for example, feedback surveys employ nonprobability sampling. These techniques can help confirm, but not rule out hypotheses since it isn't representative of the entire population. Probability sampling, on the other hand is chosen when more information is available on the population being studied, where a sampling frame is available so that every individual has some non-zero chance of being surveyed. Probability sampling also requires more time and is more resource intensive. The main advantage of probability sampling is that it allows extrapolation of estimates developed from a small sample to a entire population.
6.2 Sample size
Epitools has excellent tools with explanations for calculation of sample size under different circumstances.
The most common scenario is one where a single proportion (categorical variable) or single mean (continuous variable) has to be estimated. For
instance if one has to estimate the proportion of adults in a community with at least high school education, this is a categorical variable and if one
had to estimate the average level of schooling achieved among adults in the community this is a continuous variable. In the first case, you would be
estimating a proportion whereas in the second case you would estimate a mean. The formula required to calculate sample size to in both scenarios is different.
To dive into details, here are a few useful resources if you wish to study further:
[1] Introduction to Survey Research: comprehensive, yet concise, overview of sampling strategies, pictographic explanations, a framework explaining survey errors
[2] Sampling Techniques & Determination of Sample Size in Applied Statistics Research: An Overview: useful, but somewhat dense, includes descriptions of different sampling strategies , and a guide on how to calculate sample size manually for different scenarios
[3] Research Methods: most useful resource, detailed, but not overwhelming explanations,
examples used to explain each type
tools: website with Sample size calculators
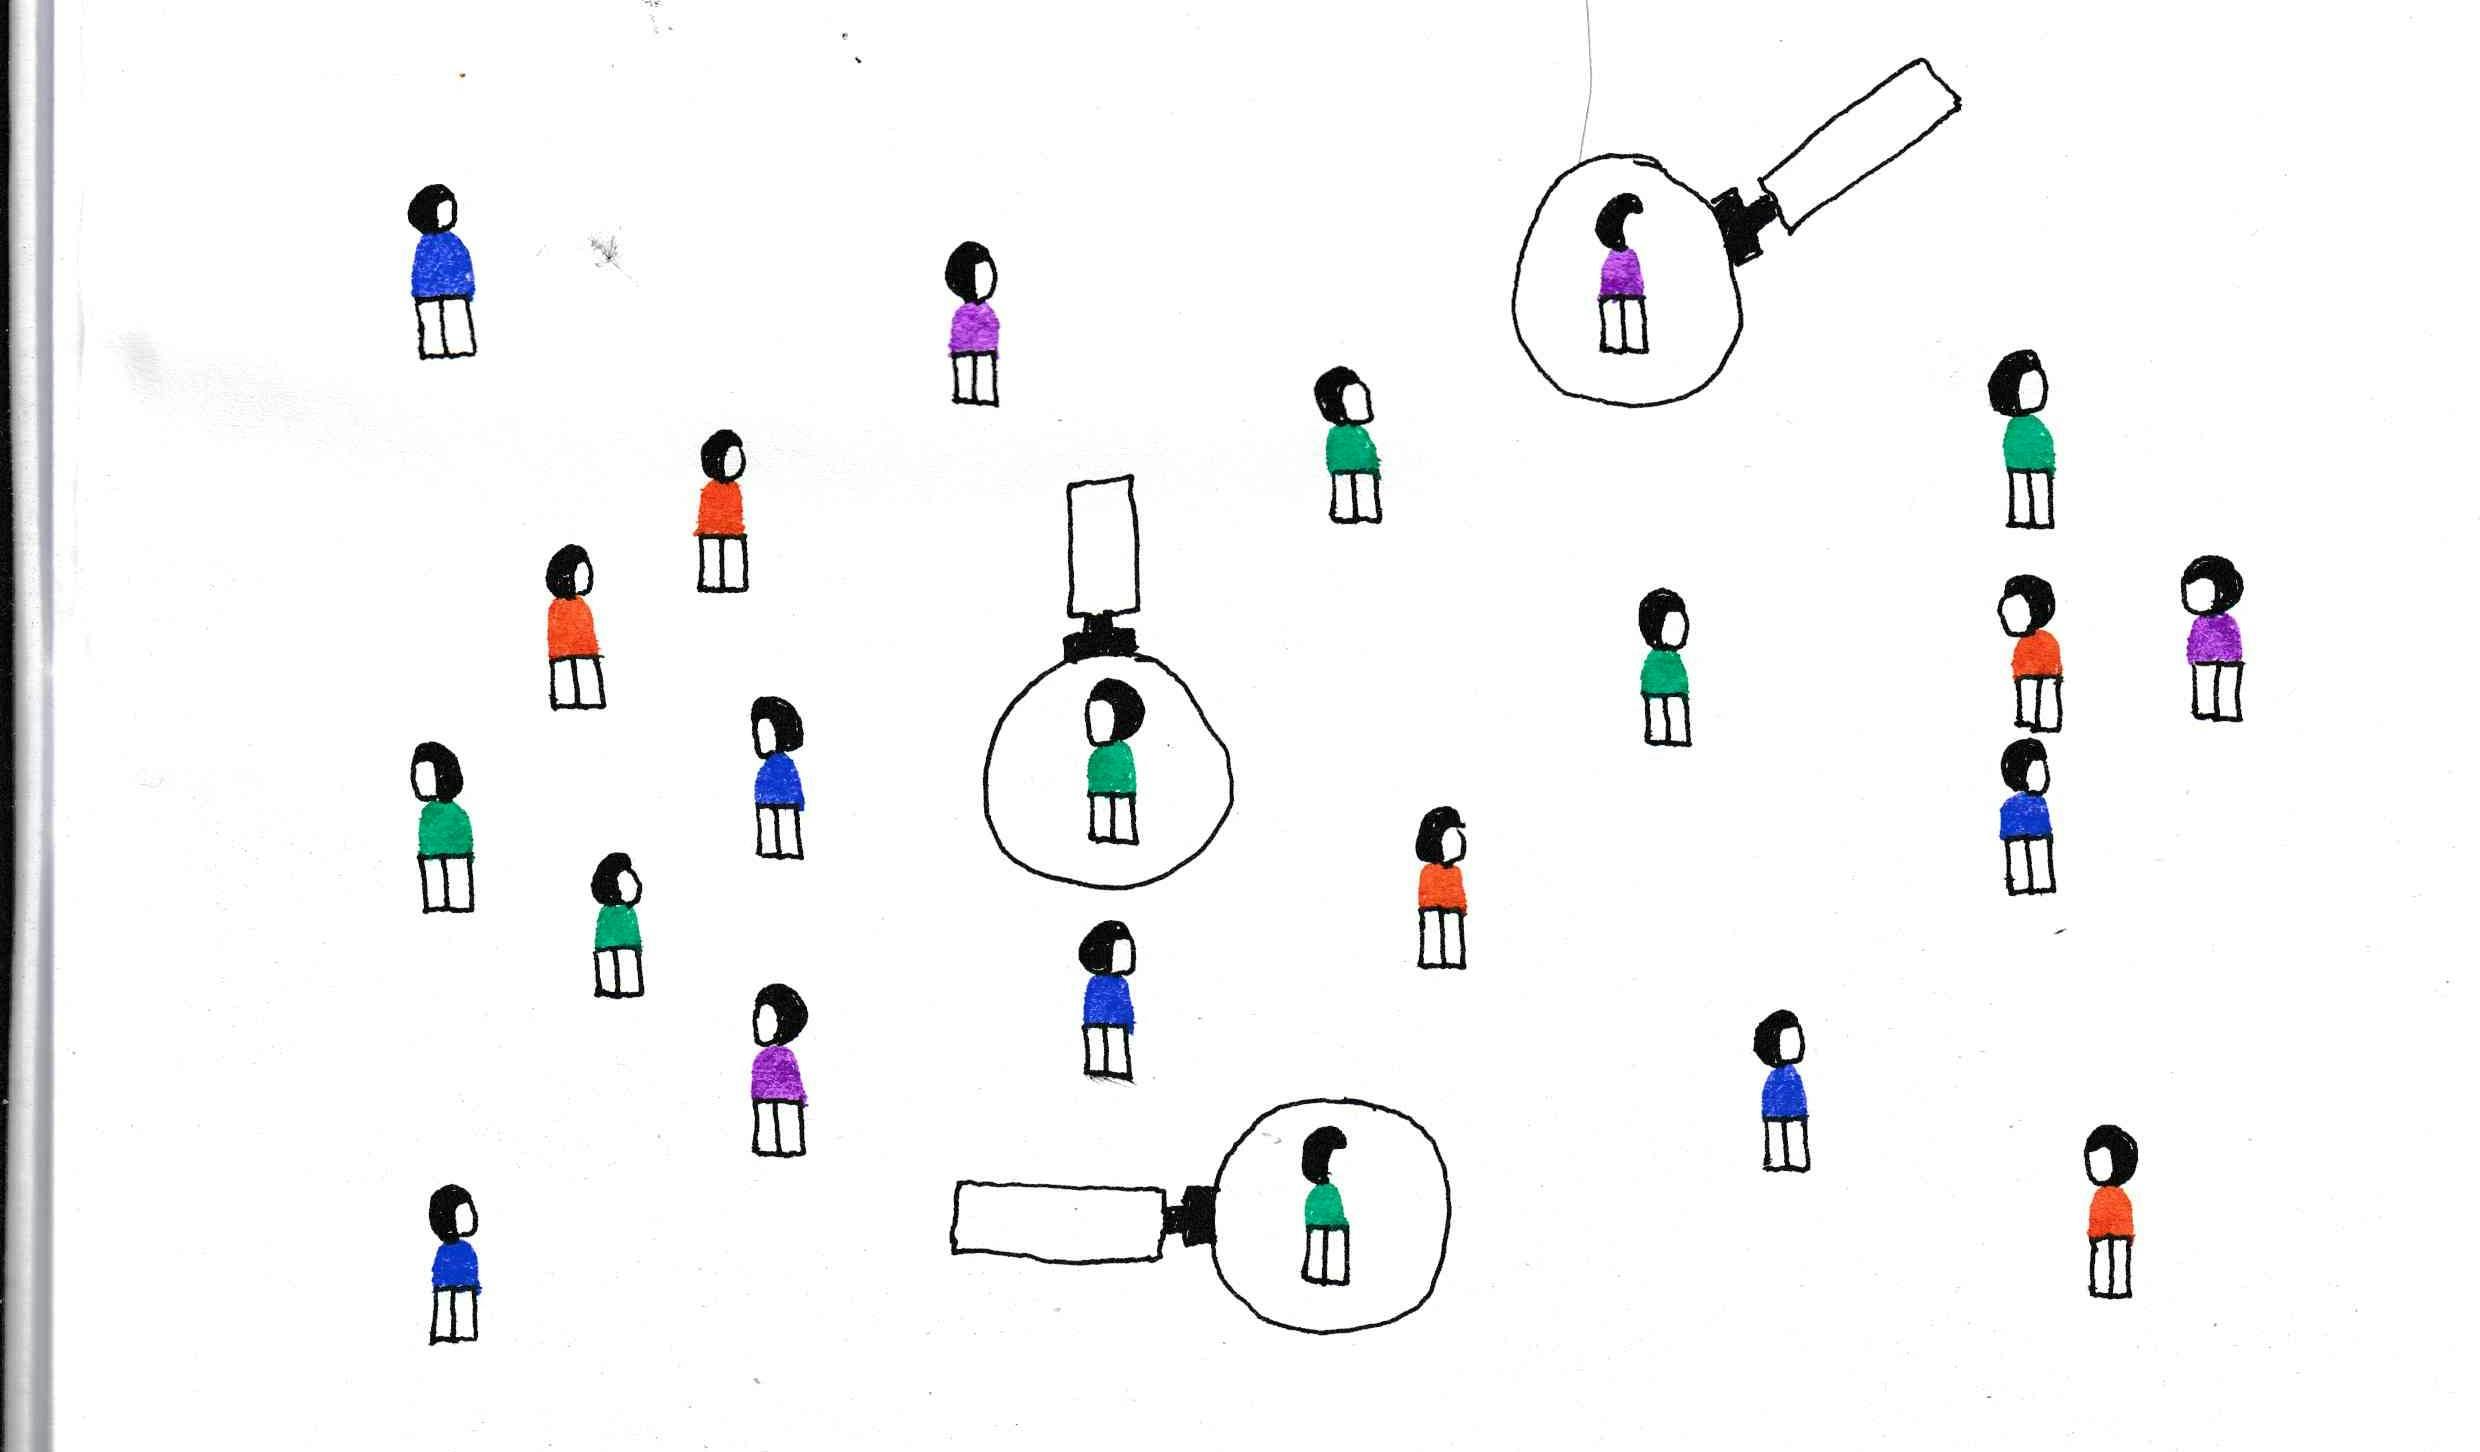 |
| 6. Sampling |
Note: I'm writing this piece based on my experience working with non-profits in the development sector and research on the subject. My experience and research has been limited to quantitative data collection with structured surveys to understand impact, qualitative data with ethnographic approaches hasn't been covered here, but I welcome inputs from others who would like to co-write something of the kind.